


The Wicheeda North Project is located approximately 80km north-northeast of Prince George and 7 km northwest of Wicheeda Lake (Figure 4-1). The property is situated on NTS mapsheet 93J09 and is centred at Latitude 54.559° N and Longitude 122.196° W. The Project claims occur immediately northwest lie north and east of Chuchinka Creek.

Accessibility
Access to the property from Prince George is provided by Highway 97 and the Chuchinka Forest Service Road (FSR) which leaves Highway 97 at Bear Lake, a small community 60km west of the Project. The total driving distance from Prince George to the southeast edge of the property is 142km. The Chuchinka FSR passes by the southwest corner of the Project tenure, a point at which the property can be traversed on foot. Deactivated, overgrown arterial logging roads wrap around the Project tenure on the north and may provide all terrain vehicle access.
Physiography, Vegetation and Climate
The Wicheeda North Project is located within the Fraser-Fort George Regional District in an area of subdued to hilly topography at elevations ranging from 740-1520m near the transition between the northern and southern Rocky Mountain Trench.
The Project is covered with stands of white and black spruce, Engelmann spruce-subalpine fir, interior cedar-hemlock, sub-boreal spruce and pine with variably thick undergrowth. Forest plantations, buck brush and devil’s club occur at lower elevations. Outcrop is sparse.
The climate of the area is humid continental (Koppen climate classification Dfb), typified by large seasonal temperature differences, with warm to hot summers and cold winters. The average annual temperature is 4.1°C. July is the warmest month with an average temperature of 15.9°C, and January is the coldest month with temperatures averaging -10.2°C. The average annual precipitation is 558mm and it is usually evenly distributed throughout the calendar year.
Local Resources and Infrastructure
The Project is located about 60km east of a major paved provincial highway, the CN rail mainline and a power transmission line. A dormant three-line sawmill, located immediately east of the Highway 97 near its junction with the Chuchinka FSR, has adequate electric power, a railway siding, and nearby gas pipeline that could be utilized for Wicheeda North Project development
.
The city of Prince George, BC, known as the “Northern Capital of British Columbia”, is located 142 road km south of the Project. The area’s population of 74,000 could provide a ready nearby work force. Major mine equipment and supply dealerships are located in Prince George and could provide the goods and services required by the Project. The community of Bear Lake (population 150), located 60km west of the Project, may be a source for labourers.
Exploration of the Wicheeda North Project has a limited history that was at least in part fueled by the discovery and exploration success of the Wicheeda property located 10km to the southeast.
Claim staking to cover the Project area, then known as the Chuchinka property, was completed by Montoro in October 2008 and February-October 2009. There is no record of any work completed on the Project until 2010.
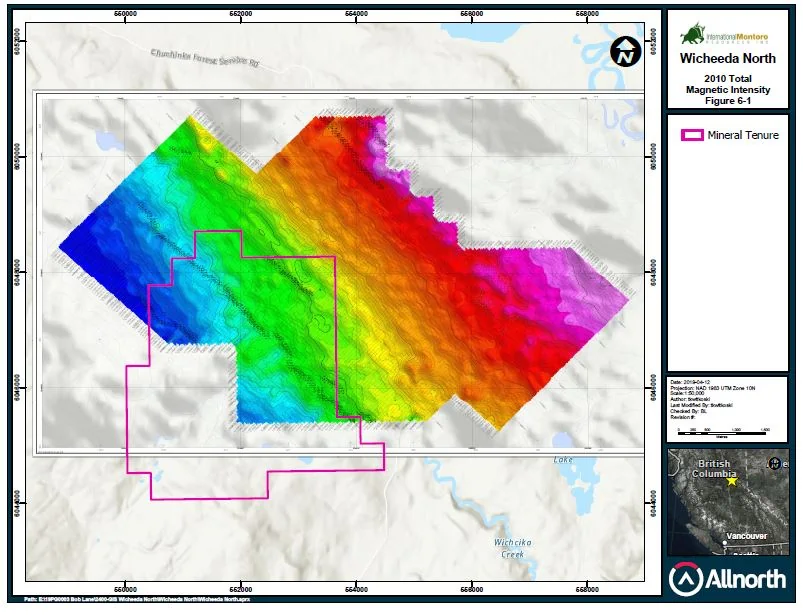
In 2010, operator Electric Metals Inc. on behalf of Montoro, then owner of mineral claims that in part coincide with those of the Project, contracted Aeroquest International to complete a helicopter-borne AeroTEM survey of the Project area. It consisted of electromagnetic, magnetic and radiometric geophysical surveys that covered a total of 693 line-kms (Theny, 2011). The survey covers approximately the northeast half of the Project claims.
The total magnetic intensity (TMI) data is dominated by a northwest-trending grain that is parallel to sub-parallel to regional geologic and structural trends (Figure 6-1). Filtering out the northwest pattern revealed five discrete circular magnetic features, none of which are on the Project claims, and two elongate magnetic lows, one of which covers the northeast corner of the Project claims. The latter may be a response to slight geological differences within the underlying sedimentary sequences (Theny, 2011).
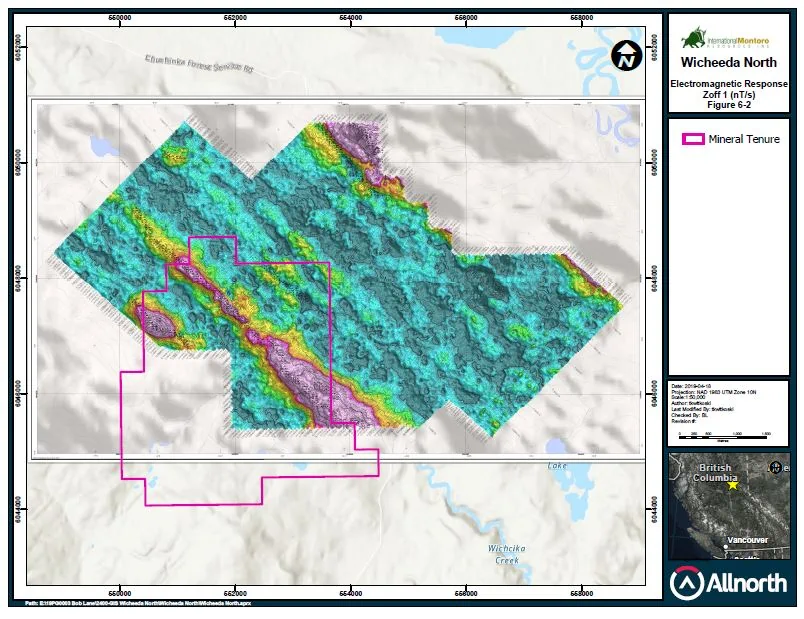
The electromagnetic (EM) data identified locations of subsurface conductive material. Three of the six anomalous trends identified occur on the Project claims (Figure 6-2): the two western-most linear features are indicative of thick or flat lying sources, and the eastern-most linear feature is indicative of a thin vertical source (Theny, 2011).
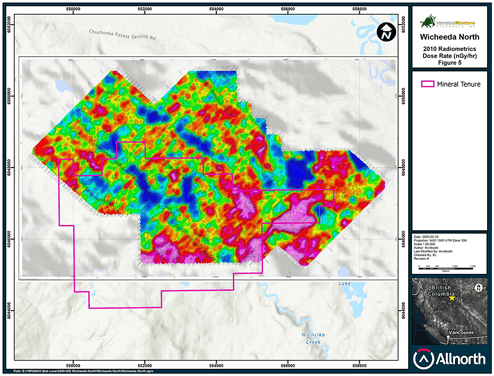
The radiometric data consists of the apparent concentrations of potassium (K %), equivalent uranium (eU ppm) and equivalent thorium (eTh ppm) that are used to calculate an estimate of the natural air absorbed dose rate (nGy/h). The main geologic processes that affect the distribution of the three elements are chemical composition of the rock, weathering of the rock, alteration of the rock and transported soil cover (Dickson and Scott, 1997). The dose rate map shows distinct areas of high and low radiometric response. On the Project claims, radiometric lows are located in topographic lows and may represent suppression of radiometric signals by thicker overburden, and radiometric highs are located on topographic highs with more outcrop exposure. In summary the radiometric survey data does not provide any clear vectors for identifying REE deposit on the Project claims (Theny, 2011).


In 2010, Electric Metals also completed four small soil geochemical grids; three of these grids, A, B and D are located on the Project claims, while grid C is located off the Project to the north. Most of the results for light REE were at or below background. Lanthanum (La) ranged from 2.5 – 109.5 ppm, Cerium ranged from 2.68 – 260 ppm, Neodymium (Nd) ranged from 2.83 – 110.4 ppm, Praseodymium (Pr) ranged from 0.7 – 28.5, and Samarium (Sm) ranged from 0.9 – 16 ppm. One spot anomaly on Line 3 of the D grid is responsible for all of the highest light REE values. Heavy REEs were not present in anomalous concentrations. The spot anomaly identified in Grid D was not further investigated.
In 2014, Montoro completed a small soil geochemical survey on the Chuchinka property but east of the current Project claims (Beck and Ledwon, 2015). The work was done for assessment purposes, but the claims were later allowed to lapse.
In March 2017, the Chuchinka Project claims were allowed to forfeit. Some of the claims were reacquired in 2019 by Montoro, such that the new claim group, referred to as the Wicheeda North Project, coincides with part of the former Chuchinka property that the company had previously owned.
In 2019, Montoro completed a modest exploration program consisting of 1) reprocessing and reinterpretation of the 2010 airborne geophysical data, and 2) grid-based soil sampling, prospecting, and limited rock sampling.
The Wicheeda North Project is located in the Foreland Belt, a morphogeological belt of folded and imbricated miogeoclinal rocks that forms the eastern mountain ranges and foothills of the Canadian Cordillera (Gabrielse et al., 1991). The regional geology of the area was mapped initially by Armstrong et al. (1969, McLeod Lake map sheet), and later by Taylor and Stott (1979, Monkman Pass map sheet) and Struik (1994, McLeod Lake map sheet). The regional geology map presented in Figure 7-1 is from a 1:250,000 scale digital compilation of the area (Digital Geology Map of British Columbia, BC MEMPR, Geofile 2005-2).
The bedrock underlying the property and enclosing areas consists mainly of limestone, marble, siltstone, argillite and calcareous sedimentary rocks that have been assigned to the Cambrian to Ordovician Kechika Group. The strata generally strike from 120-140° with steep dips to the northwest or southeast. North and east of the property, rocks of the Kechika Group are in fault contact with unassigned carbonates, slates and siltstones of Cambrian to Devonian age. Further northeast of the Project, in the Parsnip River valley, marine clastic rocks including slate, quartzite, diamictite, phyllite and carbonates of the Precambrian Misinchinka Group dominate. West of the property, rocks of the Kechika Group are in fault contact with quartzitic rocks of the Upper Proterozoic to Permian Gog Group and unassigned felsic volcanics of Devonian to Permian age.
The northwest-trending Rocky Mountain Trench, which follows the Parsnip River valley east of the Project, is the dominant structural and geographical feature in the area. A number of major related northwest-trending strike-slip faults and shear zones occur in the area. Struik (1994) divides the McLeod Lake map area into four fault-bounded tectonic domains; the Project falls within the Interior Plateau domain.
In British Columbia, a small number of carbonatite-related complexes occur. These complexes are typically sub-circular to elongate in plan and commonly have well-developed metasomatic alteration haloes. Many of the intrusions that follow the trend of the Rocky Mountain Trench are Devono-Mississippian in age and are thought to have a spatial relationship with the margin of ancestral North America (Pell, 1987). They were subjected to sub-greenschist facies metamorphism during the Columbian orogeny but behaved as inflexible and cohesive bodies during orogenesis and were rotated, tilted and/or transported eastwards in thrust panels (Pell, 1987).


The Wicheeda North Project is at an early stage of exploration. No bedrock mapping has been completed on the claims that comprise the Project, therefore little is known regarding the geology of the Project other than the regional geology described above.
It is not known if carbonatite complexes or REE mineralization occur on the Project.
Deposit Types
The Wicheeda North Project lies within the British Columbia alkaline province, a potentially important but largely unexplored rare metal metallogenic province in the foreland fold and thrust belt of the Canadian Cordillera. The Project is located approximately 7km northwest of the Wicheeda property which includes a significant REE-enriched carbonatite deposit (described below). The type of deposit being sought on the Wicheeda North Project is that of a carbonatite enriched in REE.
Carbonatites are defined by the International Union of Geological Sciences (IUGS) system of igneous rock classification as consisting of >50% primary carbonate minerals (such as calcite, dolomite, and ankerite) and <20% SiO2 (Le Maitre, 2002). Most identified carbonatites are intrusive bodies, but a few extrusive examples are known, including the active Oldoinyo Lengai carbonatite volcano in northern Tanzania (Van Straaten, 1989). Carbonatites can be quite diverse and likely originate from multiple processes (Woolley, 2003; Mitchell, 2005).
Worldwide, carbonatites and related rocks are the main sources of REE (e.g., Bayan Obo mine, Inner Mongolia; Kynicky et al., 2012) and Nb (e.g., Araxá mine, Brazil; Biondi, 2005) and can be economic targets for many other elements and mineral commodities including F, P, Al, Fe, Ti, Zr, V, Cu, Ni, Au, PGE, Ta, Sr, U, Th, phlogopite, vermiculite, olivine, lime, and barite (Mariano, 1989; Pell, 1996).
REE are defined as the elements from lanthanum (La) to lutetium (Lu; atomic numbers 57 to 71) and yttrium (Y; atomic number 39; fig. 2). Yttrium is typically included as a REE with the “lanthanides” (La to Lu) because of its similarity in chemical properties and applications. The elements from lanthanum to gadolinium (Gd; atomic number 64) are referred to as light REE; the elements from terbium (Tb) to Lu are referred to as heavy REE (Verplanck et al., 2014).
In the Canadian Cordillera, carbonatites were emplaced episodically, at ca. 810-700, 500, and 360-330 Ma, forming part of the British Columbia alkaline province, which defines a long (at least 1000 km), narrow (200 km) orogen-parallel belt. The ca. 810-700 Ma and 500 Ma carbonatites were injected during protracted breakup of the supercontinent Rodinia and passive margin development on the western flank of Laurentia. In contrast to these, and to most carbonatites globally, the 360-330 Ma carbonatites were emplaced near the continental margin during subduction rather than in the cratonic interior during continent (Rukhlov et al., 2018). The carbonatites on the Wicheeda Project are believed to be part of this latter group. A schematic model of the subduction-related Bayan Obo carbonatite (Ling et al., 2013) is shown below (Figure 8-1); it may act as a general genetic model for the formation of the Wicheeda carbonatite.
The Wicheeda REE deposit (Figure 8-2) located 7km to the southeast, is an example of REE-enriched carbonatite in the immediate area of the Project. The Wicheeda REE deposit consists of a dolomite and calcite carbonatite intrusion which appears to be semi-circular in plan view (Lane, 2010). On its western flank, the carbonatite is in fault contact with unaltered Kechika Group metasedimentary rocks. East of the fault, the carbonatite is surrounded by Kechika Group argillaceous limestone (Betmanis, 1987), which has been altered to potassic and sodic fenite (Trofanenko et al, 2014). Bastnäsite-(Ce) and subordinate monazite-(Ce) are the main REE minerals; and the REE mineralization was the product of magmatic hydrothermal fluids, which also fenitized the surrounding metasedimentary rocks (Trofanenko et al, 2014).
In the opinion of the QP, because of its proximity to the Wicheeda REE deposit, the application of an igneous carbonatite mineral deposit profile may be an appropriate model to characterize the potential depositional environment of the Wicheeda North Project. However, given that the Project is at an early stage of exploration, there have been no discoveries of such mineralization on the Project and REE-bearing carbonatite mineralization may not occur on the Project.

Schematic Model for the Formation of the Subduction-Related Bayan Obo Carbonatite

In 2019, Montoro completed a modest exploration program consisting of two components, 1) reprocessing and reinterpretation of the 2010 Chuchinka magnetic and time domain electromagnetic airborne geophysical survey that covered the northern part of the Project, and 2) soil geochemical sampling, minor prospecting, bedrock mapping and rock sampling. The reinterpretation of the 2010 geophysical data was completed by Campbell & Walker Geophysics Ltd.
Interpretation of 2010 Geophysical Survey and 2011 Interpretation
A summary and reinterpretation of the 2010 airborne magnetics and time domain EM survey was conducted by Walker (2019); it provided a qualitative assessment of the magnetic bodies and lineaments in the survey area. The magnetization vector and time domain EM inversions carried out have recovered models which provide a distribution of magnetic and conductive material that can be included in a quantitative interpretation. The anomalous magnetization within the claim block is very low amplitude. There are two anomalous flat lying conductivity trends and one thin (vertical) trend within the claim block. The trends do not appear to be related to drainage and strike in a direction similar to the Chuchinka Group as mapped in the regional geology.
2011 Magnetic Data Interpretation and Review
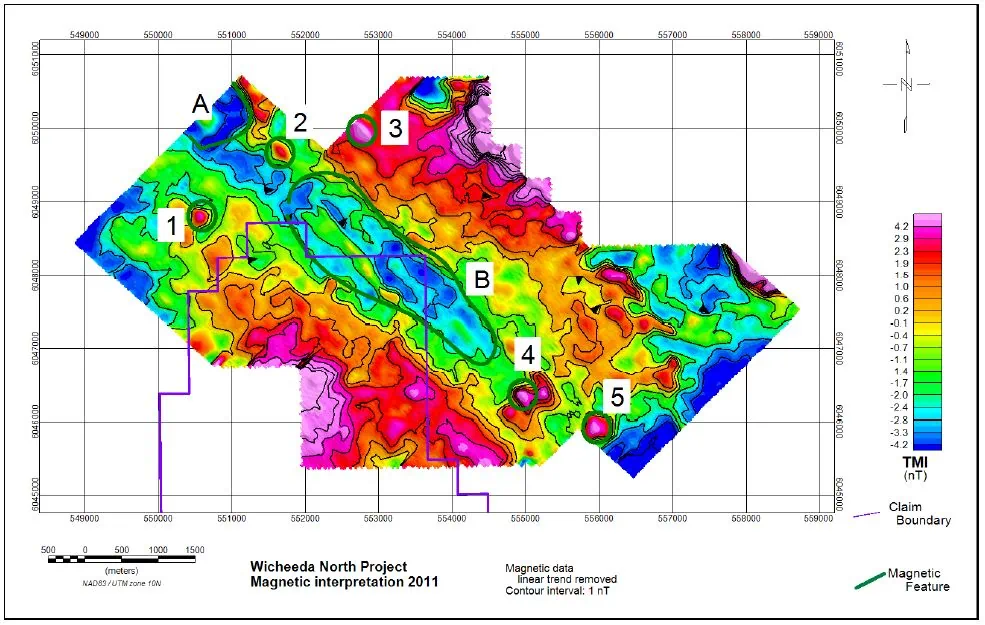
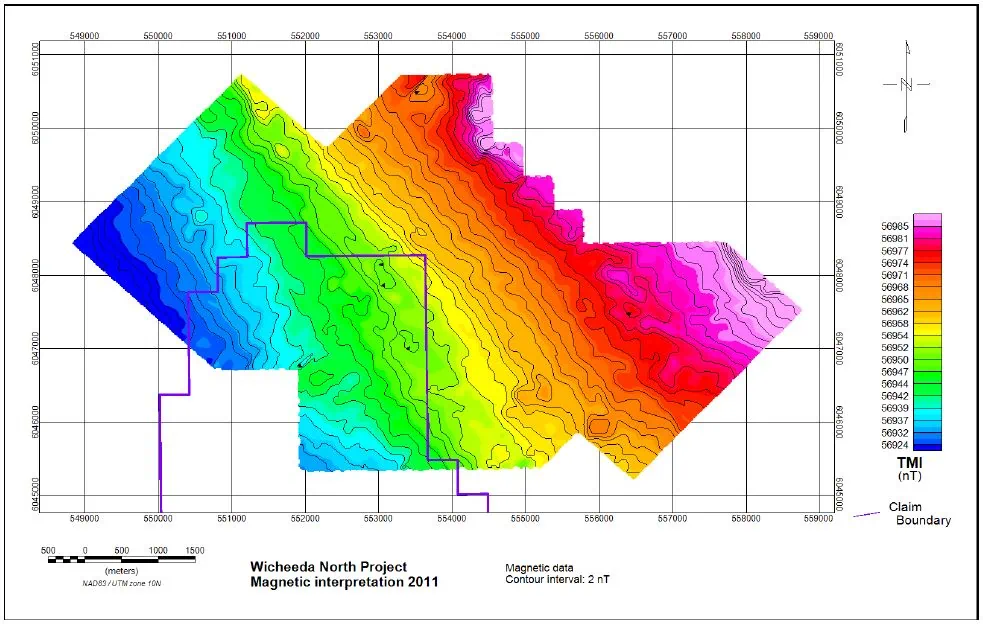
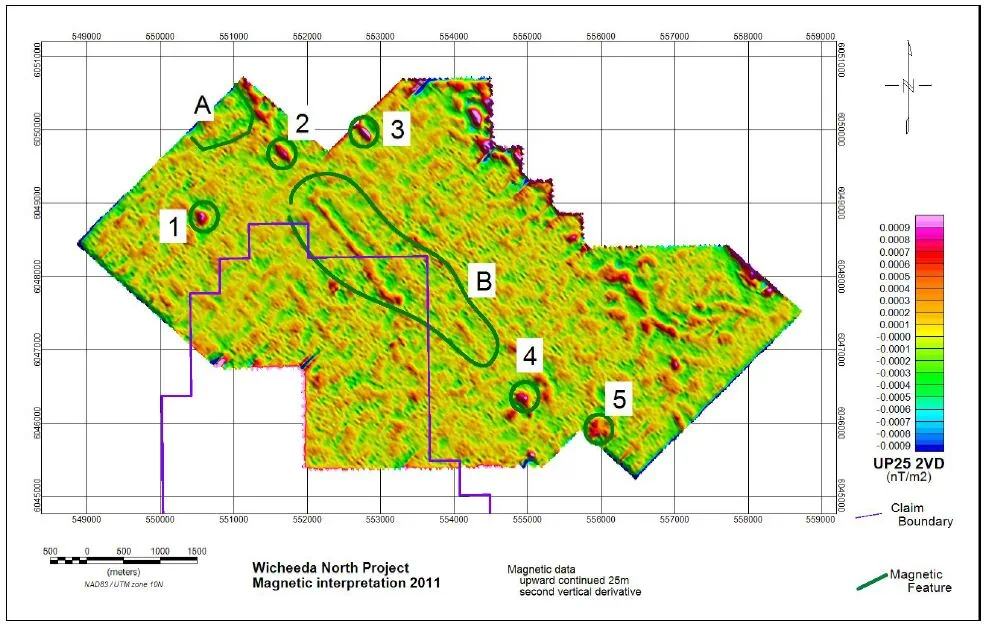
The magnetic data from the AeroTEM survey was collected at a 50 metre line spacing and a mean terrain clearance of 88 metre. The total magnetic intensity (TMI) data is dominated by a north-east regional trend (Figure 9-1). The 2011 interpretation involved the removal of the regional response by approximating a linear trend and subtracting it to produce an image of the residual magnetics (Figure 9-2). The residual magnetics was used to identify discrete features and zones within the data. The features and zones were labelled with numbers (1-5) and letters (A – B) respectively. The second vertical derivative (2VD) of the residual magnetic data was calculated in order to aid in the identification of subtle discrete features within the data (Figure 9-3). Prior to calculating the 2VD the residual data was upward continued by 25 m in order to suppress high frequency noise. The discrete responses are all magnetic highs whereas the two zones are both relative magnetic lows. The anomalies present in the data are very low amplitude < 5 nT. Only part of anomaly “B” lies within the Wicheeda North area.

Total magnetic intensity (TMI) data from Chuchinka 2011 interpretation. Purple polygon indicates the Wicheeda North claim boundary

Residual magnetics (linear trend removed) from Chuchinka 2011 interpretation. Labels indicate location of discrete responses (numbers) and zones (letters).

Second vertical derivative of the residual magnetics (linear trend removed) from Chuchinka 2011 interpretation. Labels indicate location of discrete responses (numbers) and zones (letters).
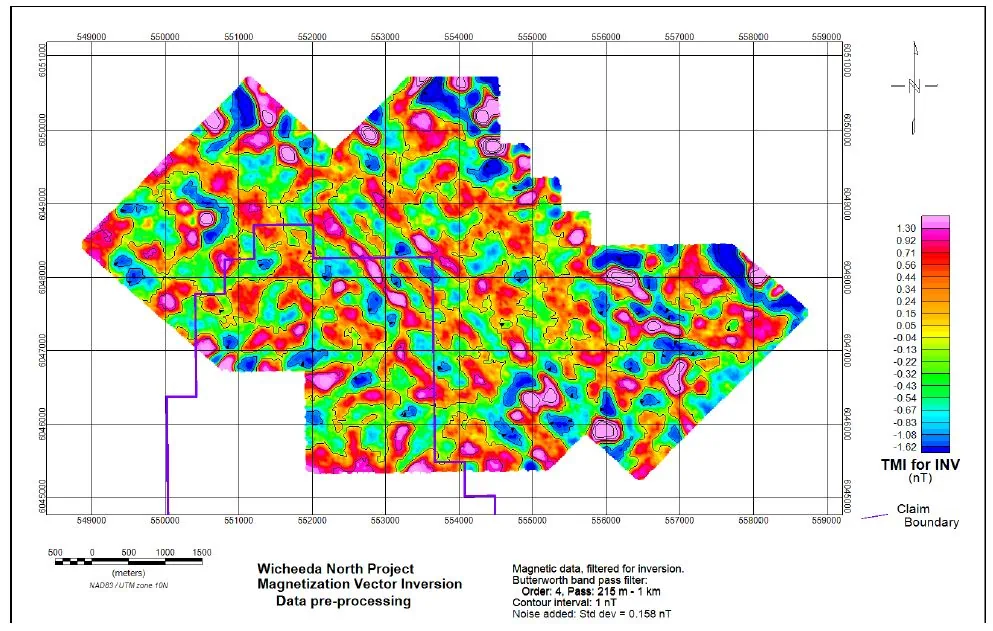
Inversion of Magnetic Data
The magnetic data from the 2010 Chuchinka survey was pre-processed prior to inversion. The data was filtered to remove long spatial wavelength regional trends. A short spatial wavelength filter was also applied in order to supress anomalies that could not be modelled well by the inversion mesh. The band pass filter applied had cut offs of 215 and 1000 metres. This filtering was carried out using Fast Fourier Transform methods on the gridded magnetic data with Geosoft’s Oasis Montaj software. The data was also down sampled to one reading per 30 m along the survey line. Random noise with a mean of zero and a standard deviation of 0.158 nT was added to the data prior to inversion. The data used in the inversion is shown in Figure 9-4. The data was inverted using Geosoft’s VOXI Magnetic Vector Inversion software (Ellis and MacLeod, 2013). The model mesh covered 8 x 6 km and consisted of 30 x 30 x 15 m voxels. Multiple inversions were carried out in order to find a model that fit the observed data within the allocated noise threshold while not adding unnecessary features to the model. The final model is the amplitude of the magnetization vector normalized to the induced field strength. This results in a model units equivalent to SI susceptibility. The error estimates used were low (<0.5 nT) and the data misfit was good overall with a standard deviation of 1 and randomly distributed values. The majority of the responses are within the top 200 metres of the model. The strongest magnetization amplitude anomaly is at the edge of the survey (blue polygon) 800 x 200m, ~ 100 m deep

Filtered magnetic data used in the inversion. Bandpass filter 215 m -1 km. Random noise added.

3D model iso-surfaces and depth slice of magnetization amplitude model near the anomalous zone. Left panel: 3D model and zoom of magnetization amplitude Iso-surfaces. Gray: 0.0001 Blue: 0.0002, Green 0.0003, Yellow 0.0004, Red 0.0005 (all units Equivalent SI). Right panel: 100 m depth slice. Anomalous zone marked on both panels.
2011 Electromagnetic Interpretation Review
An interpretation of the EM data from the 2010 Chuchinka survey was completed in 2011. The EM data from the AeroTEM survey was collected at a 50 m line spacing and a mean terrain clearance of 50 m. The time channel data from the survey were interpreted in order to identify conductive trends and or discrete bodies. Size weakly conductive trends were identified (Figure 9-6). Blue lines indicate thick (or flat lying) conductors and red lines indicate thin (or steeply dipping) conductors. All of the anomalies are characterized as weakly conductive as the majority of the signal has decayed away by the mid-time channels. The thin conductors could represent faults. The “thick” conductors do not show characteristics of discrete bedrock conductors (sharp edges) and are more likely the result of thickening flat lying conductive units (possibly sediments). Trends 1, 2 and 3 all lie within the Wicheeda North area.

Interpreted conductive trends from EM data. Blue: thick (or flat lying) conductive response. Red: Thin (or vertical) conductive response
The data was inverted using Geosoft’s VOXI Time Domain EM Inversion software (Ellis and MacLeod, 2015). The conductivity model is displayed as depth slices and iso-surfaces (Figure 9-7). Moderately conductive zones were recovered at each of the thick trends. Since the inversion uses a stitched 1D inversion it is not possible to accurately recover the thin targets like Trend 3. Trend 1 is spatially coincident (in an X-Y sense) with the magnetic anomaly identified during the MVI inversion. Target 2 and Target 3 also fall within the Wicheeda North area. The conductivity values are quite low (3 x 10⁻³ S/m). The pattern of responses does not match the characteristics of carbonatites (circular, intrusive) described in Lane (2019).

3D model iso-surfaces and depth slice of conductivity model near anomalous zone. Left panel: 3D model and zoom of conductivity Iso-surfaces. Yellow: 0.001 and Red: 0.003 (all units Equivalent S/m). Right panel: 50 m depth slice. Anomalous zone marked on both panels
Soil Sampling
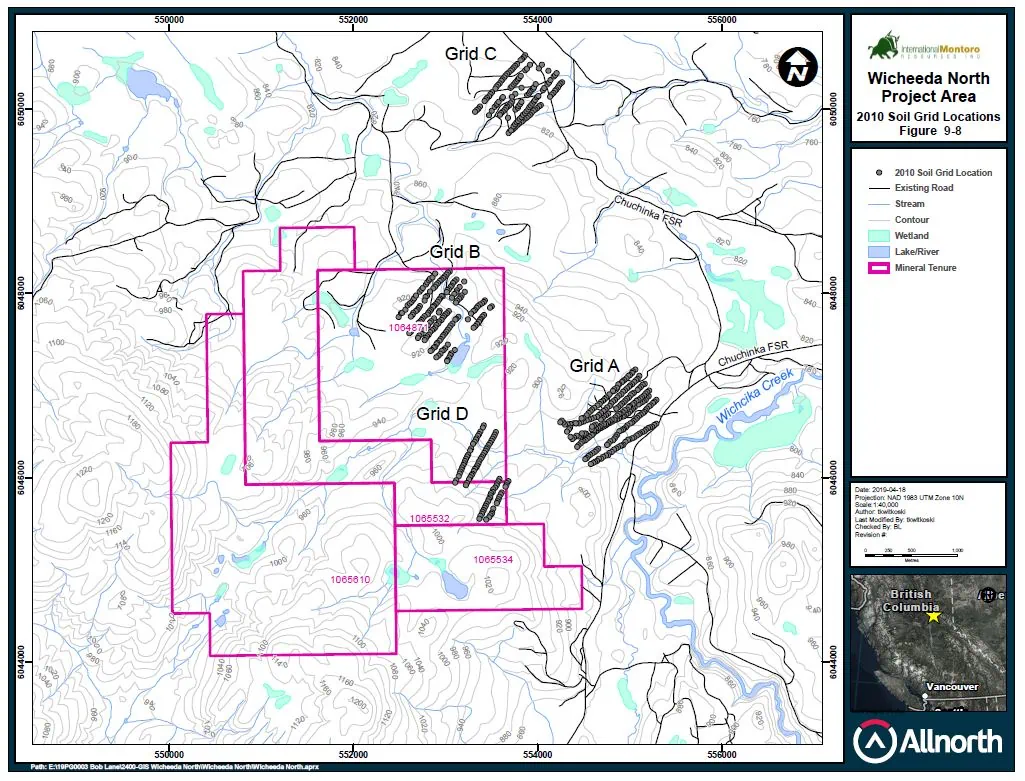
A total of 535 soil samples were collected from three areas of the property in 2019 (Figure 9-8). Soil samples were collected from the ‘B’ horizon unless thick till was encountered. Grids A-North, A-South and D-South consisted of east-west oriented lines spaced 50m apart with sample stations every 25m along the lines. Grid F consisted of east-west oriented lines spaced 100m apart with sample stations every 50m along the lines.
Anomalous values from the 2019 soil sampling program were determined using percentiles (99th percentile; 98th percentile; 95th percentile, 90th percentile); values of <90th percentile were regarded as background. Minimum, maximum and average values for the Light REEs and listed in Table.

Thematic maps for Cerium (Figure 9-9), Lanthanum (Figure 9-10) and Neodymium (Figure 9-11) are shown following a discussion of results. Soil geochemical anomalies for the Light REEs generally follow that of Cerium (Ce). Grid A-North includes a number of spot anomalies (one 98th percentile, five 95th percentile and six 90th percentile) some of which outline a vague north-south linear anomaly that trends off the grid to the north. The Grid A-South anomaly consists of a cluster of four 99th percentile samples located at the southern edge of the grid. The anomaly appears to have northwest east-northeast trending tails that might be the result of dispersion from the centre of an anomaly located to the south-southwest. The anomaly on Grid D-South consists of a strong northeast trending anomaly that is defined by two 99th percentile values, two 98th percentile values and five 95th percentile values along with numerous 90th percentile values.


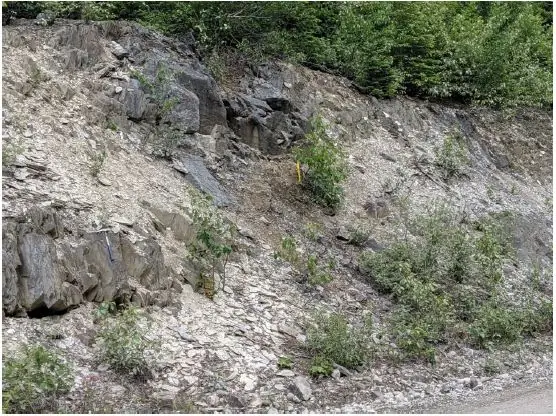
Prospecting, bedrock mapping and rock sampling took place in conjunction with the soil sampling program and as well on accessible areas of the property. Exposed bedrock on the property was found to be very sparse accounting for less than 5% of the areas investigated; angular float to sub-outcrop was almost as infrequent. However, effort was made to sample rock outcrops or rock exposed in road cuts wherever possible in order to geochemically characterize the observed geological units. A total of ten (10) rock samples were collected; five of these were taken from a from a large roadcut, exposing platy limy phyllite and limestone cut by a dark grey non-magnetic sill (Plate 9-1), on the main Chuchinka FSR where it crosses the southeast corner of the property. A sample of the sill returned anomalous Niobium and REE values. Other rock samples consisted of country rock or quartz-carbonate (± pyrite and/or Fe and Mn oxides). Rock sample descriptions and results are provided in Table 9-2 and shown on Figure 9-12.
In addition, two silt samples were collected to assess the up-drainage potential of parts of two drainages on the Project (see Figure 9-12). Both samples returned background REE values.
Prospecting and bedrock mapping and rock sampling should continue in concert with soil sampling. In addition, a scintillometer could be used as a means of measuring low level gamma radiation that can be associated with carbonatite-hosted REE mineralization.

Plate 9-1: Road cut exposing platy, limy phyllite and dark grey non-magnetic sill


The present configuration of mineral tenure in the immediate area of the Project is shown in Figure 23-1.
The principal nearby property of importance is the Wicheeda property of Defense Metals Corp. (DMC) which is centred approximately 10km southeast of the Wicheeda North Project. The Wicheeda property includes the Main Zone rare earth element (REE) deposit that was delineated by 14 diamond drillholes (2,244m) in 2008-2009 by then owner/operator Spectrum Mining Corp. (Lane, 2009; Lane, 2010) and by 13 diamond holes (2007.5m) drilled in 2019 by DMC (Raffle and Nicholls, 2020). The dimensions of the Main Zone, as defined by drilling, are approximately 400m north-south by 100-250m east-west. Diamond drilling data supports the interpretation of a moderately north-northeast dipping, shallowly north plunging, layered sill complex having syenite at its base, overlain by hybrid matrix to clast-supported limestone or mafic intrusive xenolithic carbonatite (fenite), and finally significantly REE-bearing dolomite-carbonatite rocks, which form the main body of the Wicheeda REE Deposit that outcrop (Raffle and Nicholls, 2020). This layered sill complex occurs within an unmineralized limestone. The intrusive carbonatite contains significant concentrations of the light REE including Ce, La, Pr, Nd, Sm, Eu and Gd as well as anomalous concentrations of Mo, Ba, Sr, Mn, As and P, and elevated levels of Y and several of the other heavy rare earth elements. In 2020, an updated mineral resource estimate for the Wicheeda deposit consisted of an Indicated Mineral Resource of 4.89 million tonnes averaging 3.02% light rare earth oxide (LREO) and an Inferred Mineral Resource of 12.1 million tonnes averaging 2.90% LREO at a cut-off grade of 1.5% LREO (Raffle and Nicholls, 2020).
The QP has not verified the Wicheeda mineral resource estimates; they are provided here as an example of a nearby carbonatite-hosted REE deposit, however mineralization similar to that found on the Wicheeda property has not been located on the Wicheeda North Project.
Adjoining the Project to the northwest is the Snip property, a block of four claims registered as 100%-owned by Jody Dahrouge. The most recent exploration on the Snip property was completed in 2011 by Remstar Resources. The work consisted of a 219 line-km program of high resolution airborne EM/MAG and Gamma-Ray Spectrometric surveying. The geophysical survey was accompanied by a total of 65 soil and rock geochemical samples. Analytical results showed that three rock samples were weakly anomalous in REE. Overall, three EM/MAG targets were identified and believed to coincide with the magnetite anomalies within the claim area. Airborne data were correlated with soil and rock samples and also sporadic ground radiometric measurements to establish priority REE drill targets. Although the results of surface sampling revealed that some samples were anomalous, they were not sufficiently compelling to warrant further exploration on the Snip property (Tavakoli, 2012).
Adjoining the Project to the west-northwest and northeast are claims owned by David Joseph Javorsky and adjoining the Project to the west is a claim owned by Ali Salman Jamal. These claims were part of or adjoin the former Chuchinka property.
The QP has been unable to verify all of the information presented in this section; the information is not necessarily indicative of the mineralization on the Project that is the subject of this technical report.
